Simple, practical risk assessment software for small businesses, not-for-profits and organisations. Build clear assessments on Mac, iPad or iPhone, then export your risk register to a spreadsheet and your diagrams to PDF or JPEG.
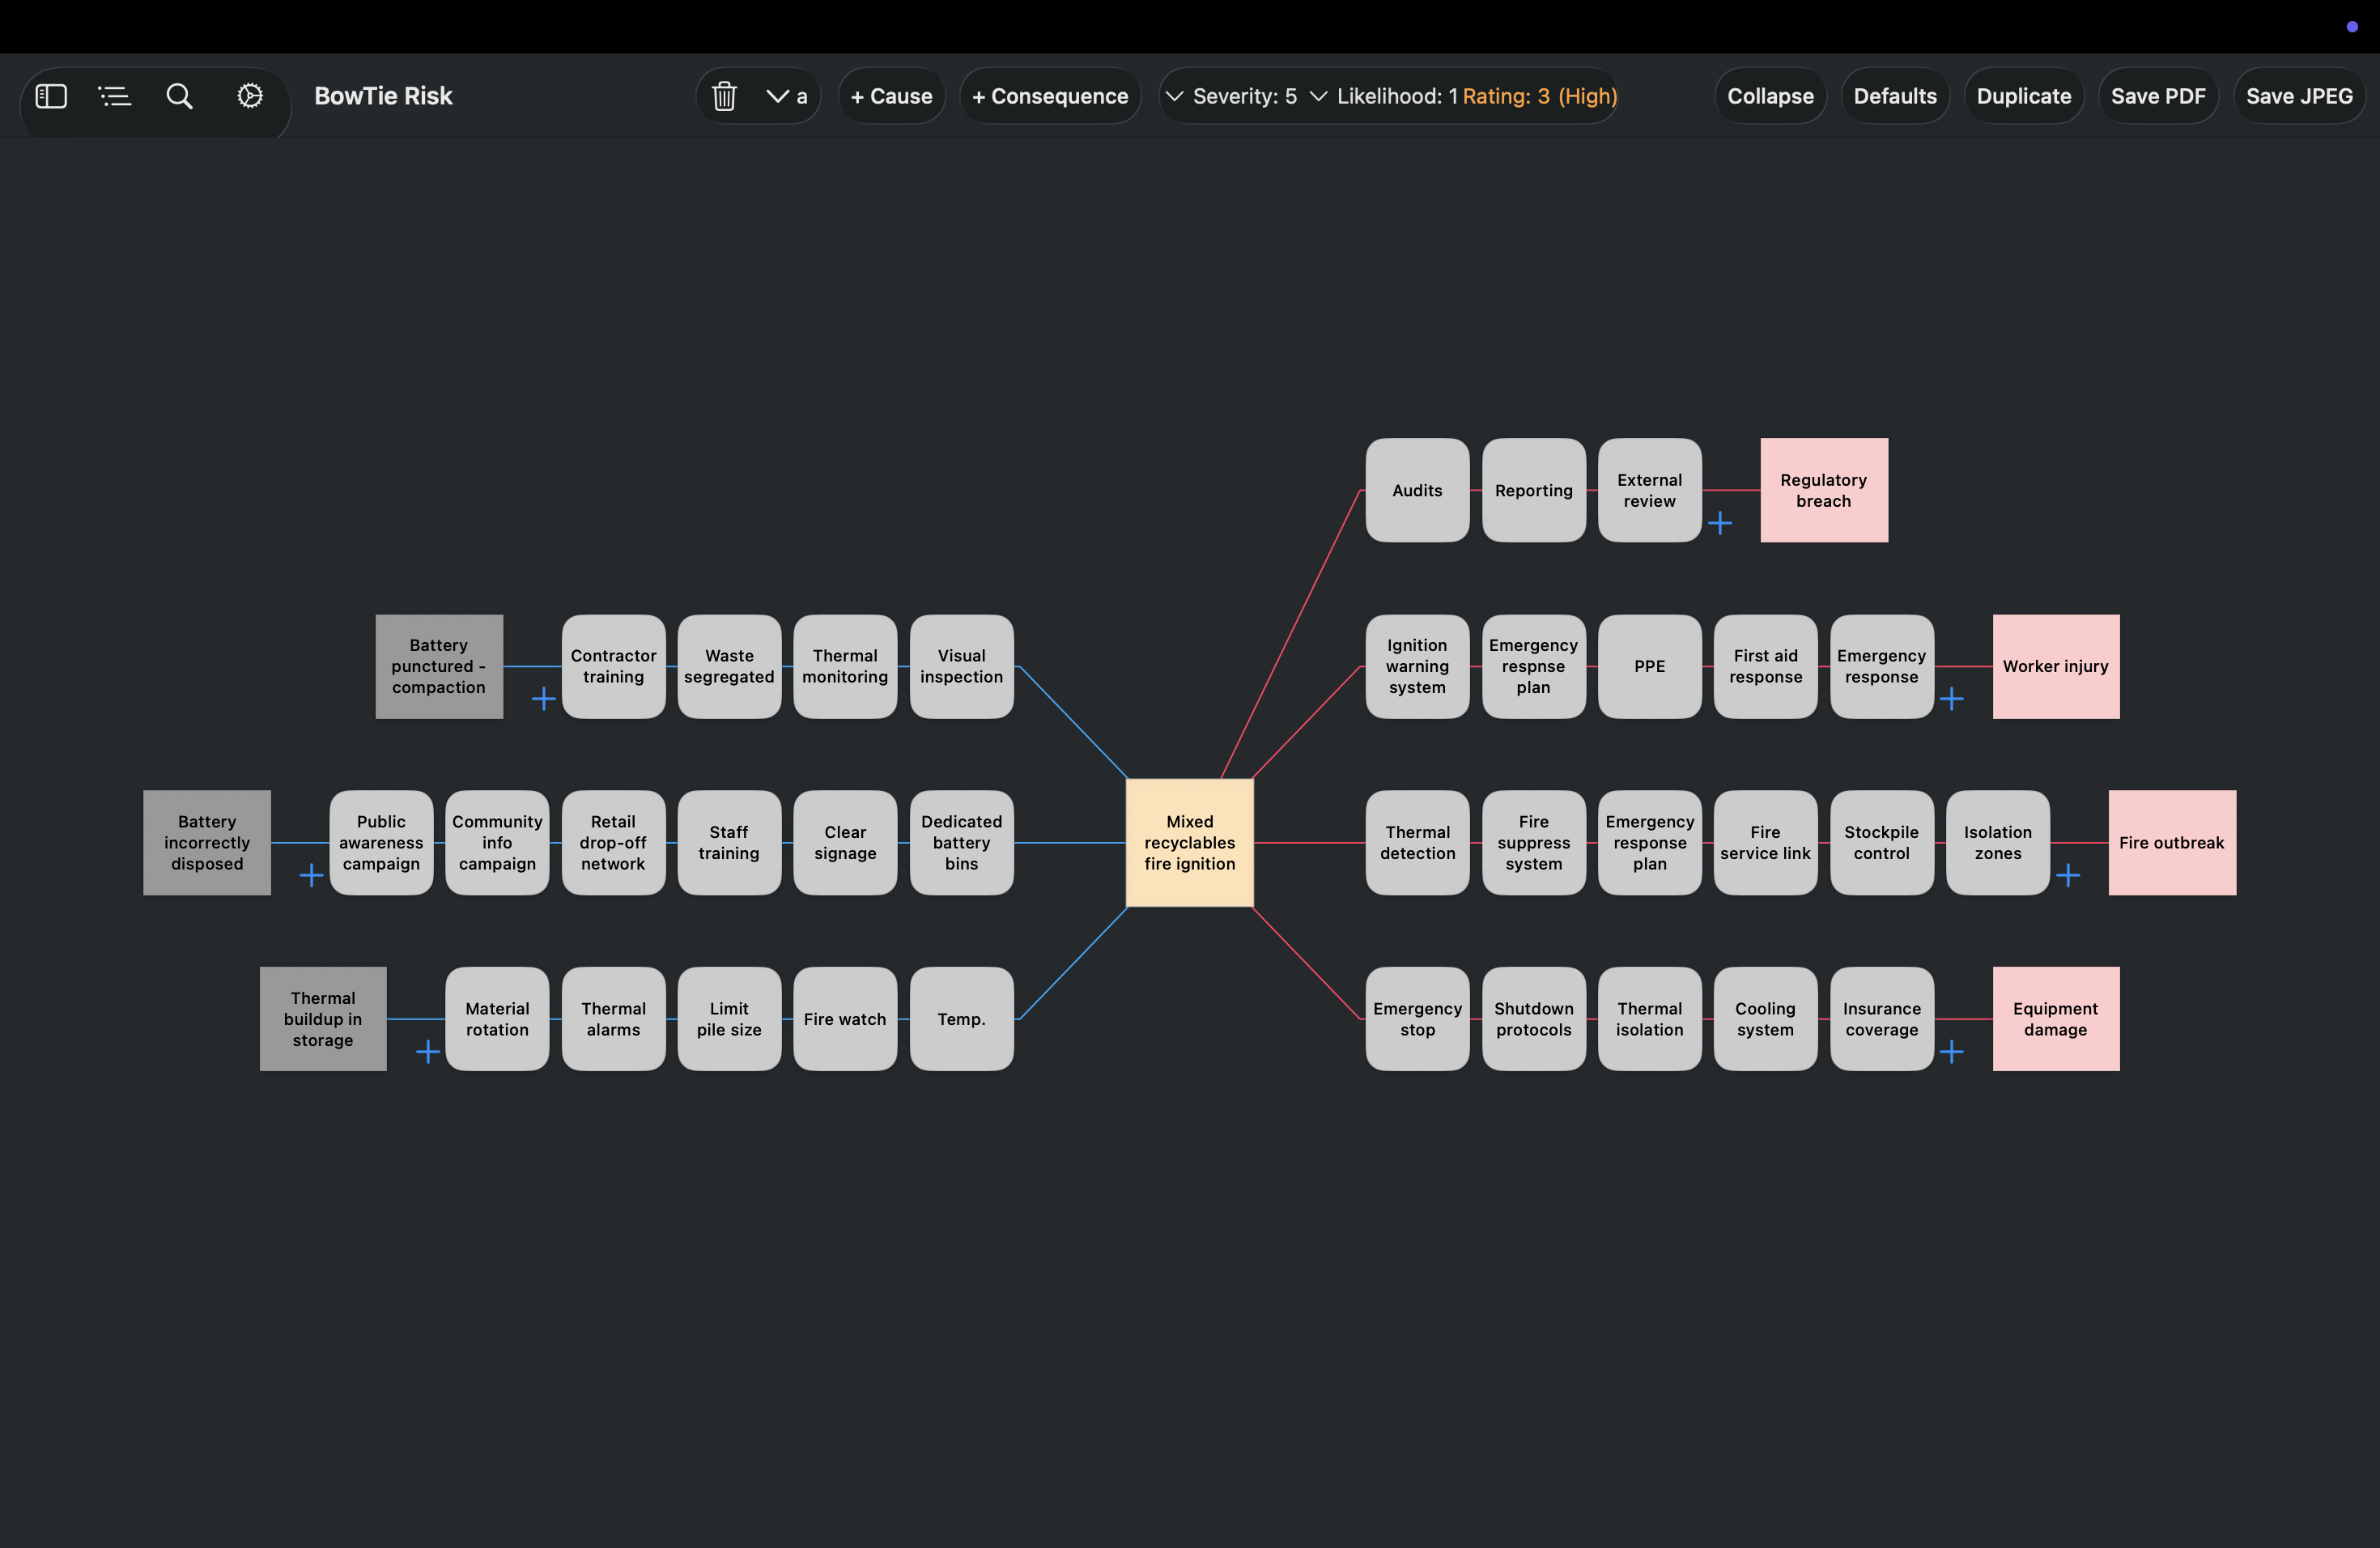
Each risk sits on its own diagram: what could cause it on the left, what could follow on the right, and the controls you rely on in between.
The layout follows a principle from cognitive science: information is grouped so each part stays within what the mind can hold at once, rather than presented as one dense block. We set out the reasoning under design philosophy.
The diagrams are called bowtie diagrams because of their shape, and are an established method for analysing risk. Further information on the method is set out in our guide, What Is a Bowtie Diagram?
You can export the results to a spreadsheet to form the basis of your risk register, alongside the diagrams themselves, which show each risk at a glance.
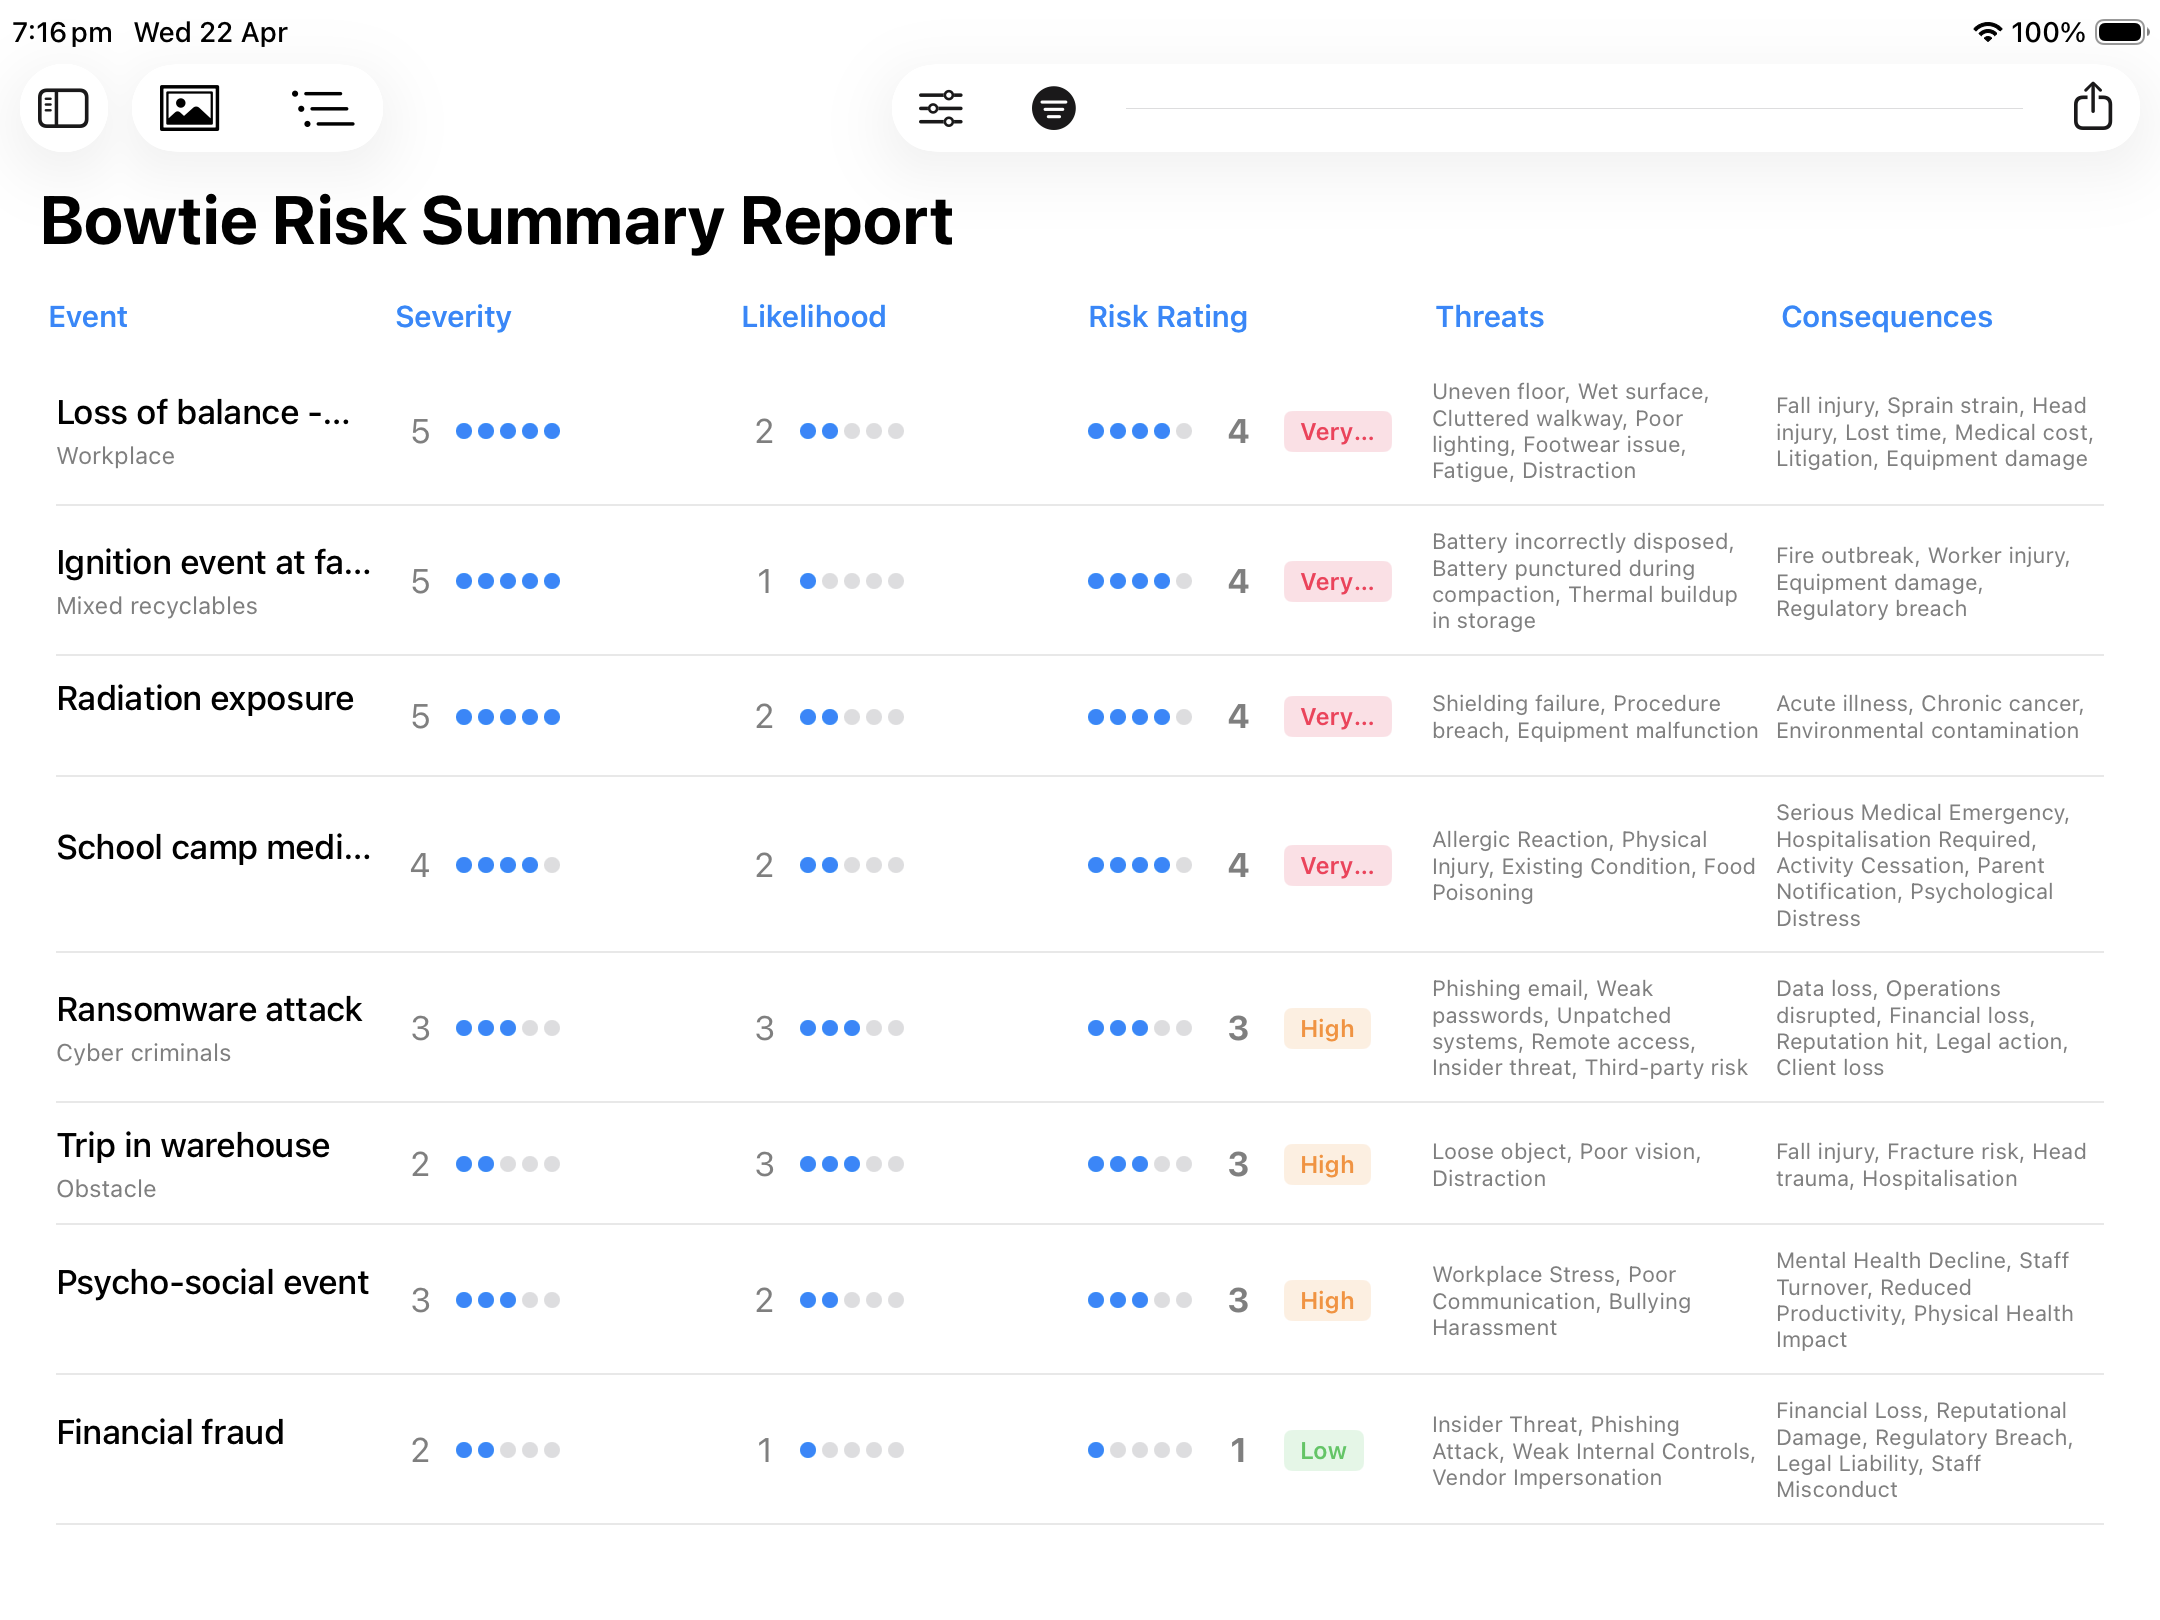
Build each risk as a clear visual assessment, then use the exported Summary Report as the basis of your risk register. The report brings together the event, risk rating, causes, consequences and controls for every assessment in the file.
Export the assessment data to CSV and continue working in your existing spreadsheet. Add information your organisation needs, such as risk owners, review dates, status and further treatments. Export individual diagrams to PDF or JPEG when you need a clear assessment for a toolbox talk, induction, audit, committee paper or client review.
The event you don't want to happen sits in the middle. Potential causes, triggers or threats are on the left. Potential consequences are on the right. Your risk controls sit in between.
Set out this way, the gaps are visible. If the only thing standing between "rushing to finish a job" and a serious injury is one person remembering to check a guard, that shows on the page, to you and to anyone else reading it.
It comes out of the diagrams you've built.
The Summary Report gives you one line per risk event: the event, your risk rating for it, causes, consequences and controls, with cross-referencing numbers. It exports as CSV, and this is the basis for your risk register.
From there you can add more columns to suit your organisation — who owns each risk, its status, when it's next reviewed, and anything else you track.
Diagrams export separately as PDF or JPEG — for a toolbox talk, an induction pack, an auditor review or a committee paper.
Each assessment is its own diagram, and the report covers every assessment in the file.
Working at height, hitting a service, plant near people. Also the assessment a builder or head contractor asks for before you're allowed on site.
Machinery, guarding, isolation and new starters.
Burns, slips, food safety and cash handling.
Events, transport of members and safety — run by volunteers and committees.
Ransomware, business email compromise, a lost laptop or a supplier breach.
Customer, member, patient and volunteer records — how they are collected, who can reach them, and what follows if they are disclosed or lost.
The event is entered at the centre of the diagram, and an optional hazard box can be added above it.
The causes, consequences and controls are entered on each side of the interactive diagram.
Your risk matrix is set up once in settings and stays in place for every assessment; a 5 × 5 matrix is the default. Enter a severity and a likelihood, and the risk rating is calculated for you. Rate at bowtie diagram level from the top toolbar, for each potential consequence, or both.
The Summary Report collects every assessment in the file and exports as CSV. A Detailed Report is also available, showing risk ratings for each consequence. Diagrams export individually as PDF or JPEG.
The free version lets you build one fully editable diagram on Mac, or two on iPad and iPhone, and export to CSV, PDF and JPEG with a watermark. A subscription removes the diagram limit and the watermark, and starts with a free trial so you can try the full risk assessment, reports and other premium features before paying.
See pricing on the home page.
You don't have to replace the way your organisation works. BowTie Risk exports your assessment data to CSV so the results can form the basis of your existing risk register. Add your own fields such as risk owner, status, review date and further treatments in your spreadsheet.
Yes. The Summary Report lists every risk you've assessed with its rating, causes and consequences, and that's the basis of your register — generated from your assessments rather than typed up separately. You then add the decisions that are yours: risk owner, further treatments, target dates and review dates go onto the exported CSV in your spreadsheet. The register stays a spreadsheet; what changes is that every line in it now traces back to an assessment you can show someone.
Yes. Nothing in the app assumes a commercial organisation. Not-for-profits, charities, clubs, sporting associations and community groups use it for the risks that come with events, working bees, transporting members, food handling, volunteer supervision and child safety. The exported register is the same one a business produces, which is what a grant application, an insurer or a member protection review generally asks to see.
Yes. The structure is the same whatever the risk — losing a key supplier or funder, a data breach, a food safety incident, an equipment failure that stops you operating. Safety, security and organisational risks can sit in the same file.
Download the free version and build your first diagram to see how it works. Start a free trial for risk assessment, reports and the other premium features.
See BowTie Risk software, safety and barrier risk assessment, or cybersecurity risk assessment.