Safety Risk Assessment
Create, edit and review workplace risk assessments on Mac, iPad and iPhone. Record hazards and controls, rate risk with your own matrix, and produce registers and reports your team can actually read.
Used by risk professionals across 40 countries.
Free to download. Premium subscriptions available. See pricing
Safety advisers
Build and maintain assessments for material and critical risks.
Site supervisors
Brief crews on risks and controls before work starts.
Safety committees
Review registers and residual ratings at meetings.
Consultants
Run client workshops and deliver clear reports.
Workers & contractors
See the controls they rely on, on their phone.
The familiar four-step risk management process.
No specialist training needed. BowTie Risk follows the identify, assess, control and review approach used in workplace health and safety codes of practice and in ISO 45001.
Identify hazards
Name the unwanted event, such as a trip in a warehouse, a fall from height or a battery fire, and list the causes that could lead to it.
Assess risks
Record what could happen if the event occurs, then rate severity and likelihood using your organisation's risk matrix.
Control risks
Attach the controls you rely on to each cause and consequence, with notes on how they work, then rate the residual risk after controls.
Review controls
Revisit the assessment when work, equipment or conditions change. Update controls, re-rate the risk and share the latest register or report. Export to create a spreadsheet for tracking control owners, review dates and actions.
Build and maintain assessments in one place.
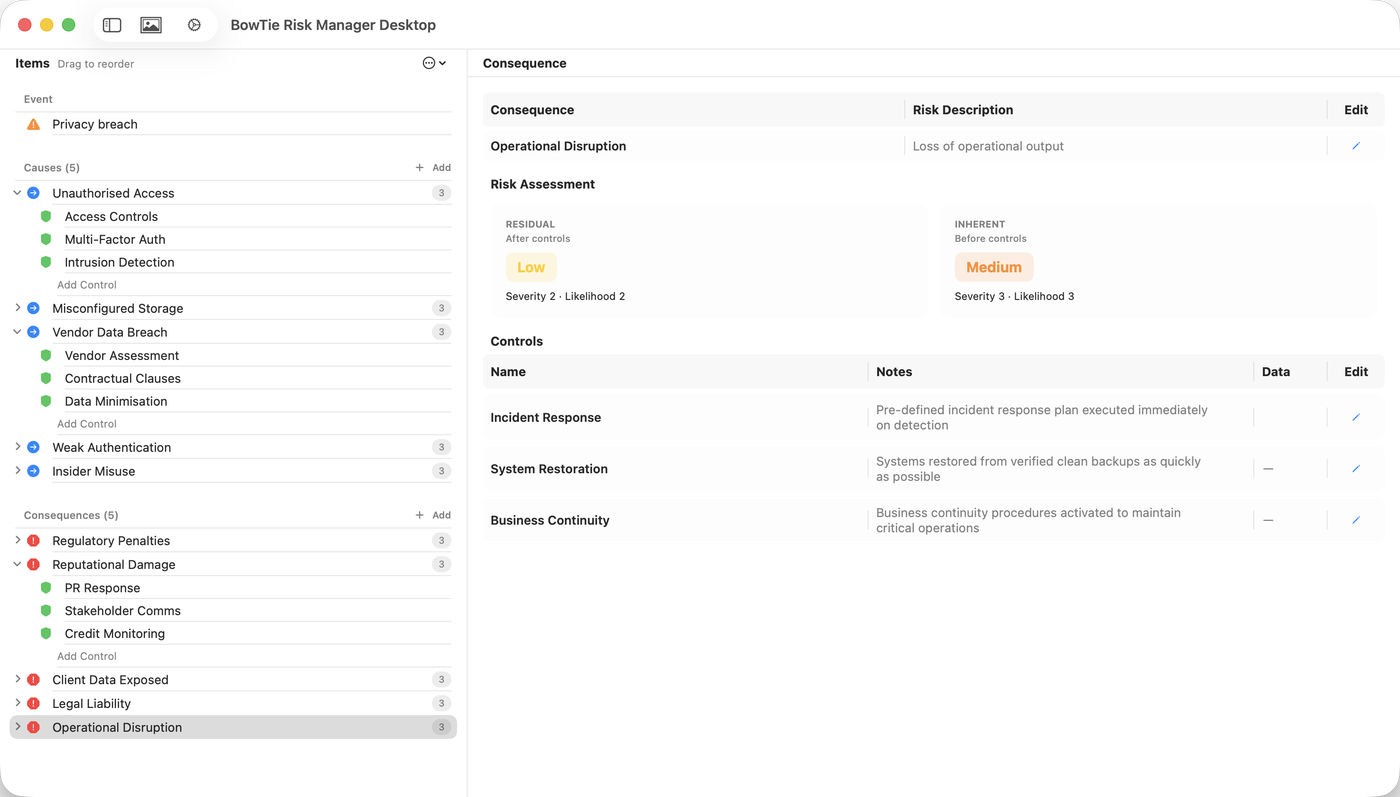
Every part of an assessment sits in a single, structured list. Select an item to edit its details, ratings and controls alongside it.
Structured item list
The event, causes, consequences and controls are shown together. Add new items where you need them and drag to reorder as the assessment develops.
Inherent and residual risk
Record severity and likelihood before controls and after controls, so the effect of your controls is visible at a glance.
Your own risk matrix
Configure likelihood and consequence scales and rating labels to match your organisation's WHS or HSE framework.
Notes that stay with the risk
Keep descriptions, control notes and supporting information with the item they relate to, ready for review and audit.
Know which controls you are relying on.
A risk rating alone doesn't show how a risk is managed. BowTie Risk links each control to the specific cause or consequence it addresses.
Preventive controls sit against the causes that could lead to an event. Mitigating controls sit against the consequences, covering emergency response, first aid, recovery and escalation if prevention fails. Seeing both side by side makes gaps easier to spot.
The approach complements an existing hierarchy-of-controls process. The hierarchy tells you how strong a control is; the assessment shows exactly where it sits and what it is expected to do. Together they help identify over-reliance on administrative controls, controls that depend on the same person or system, or pathways with no effective control at all.
Risk registers and reports, ready to share.
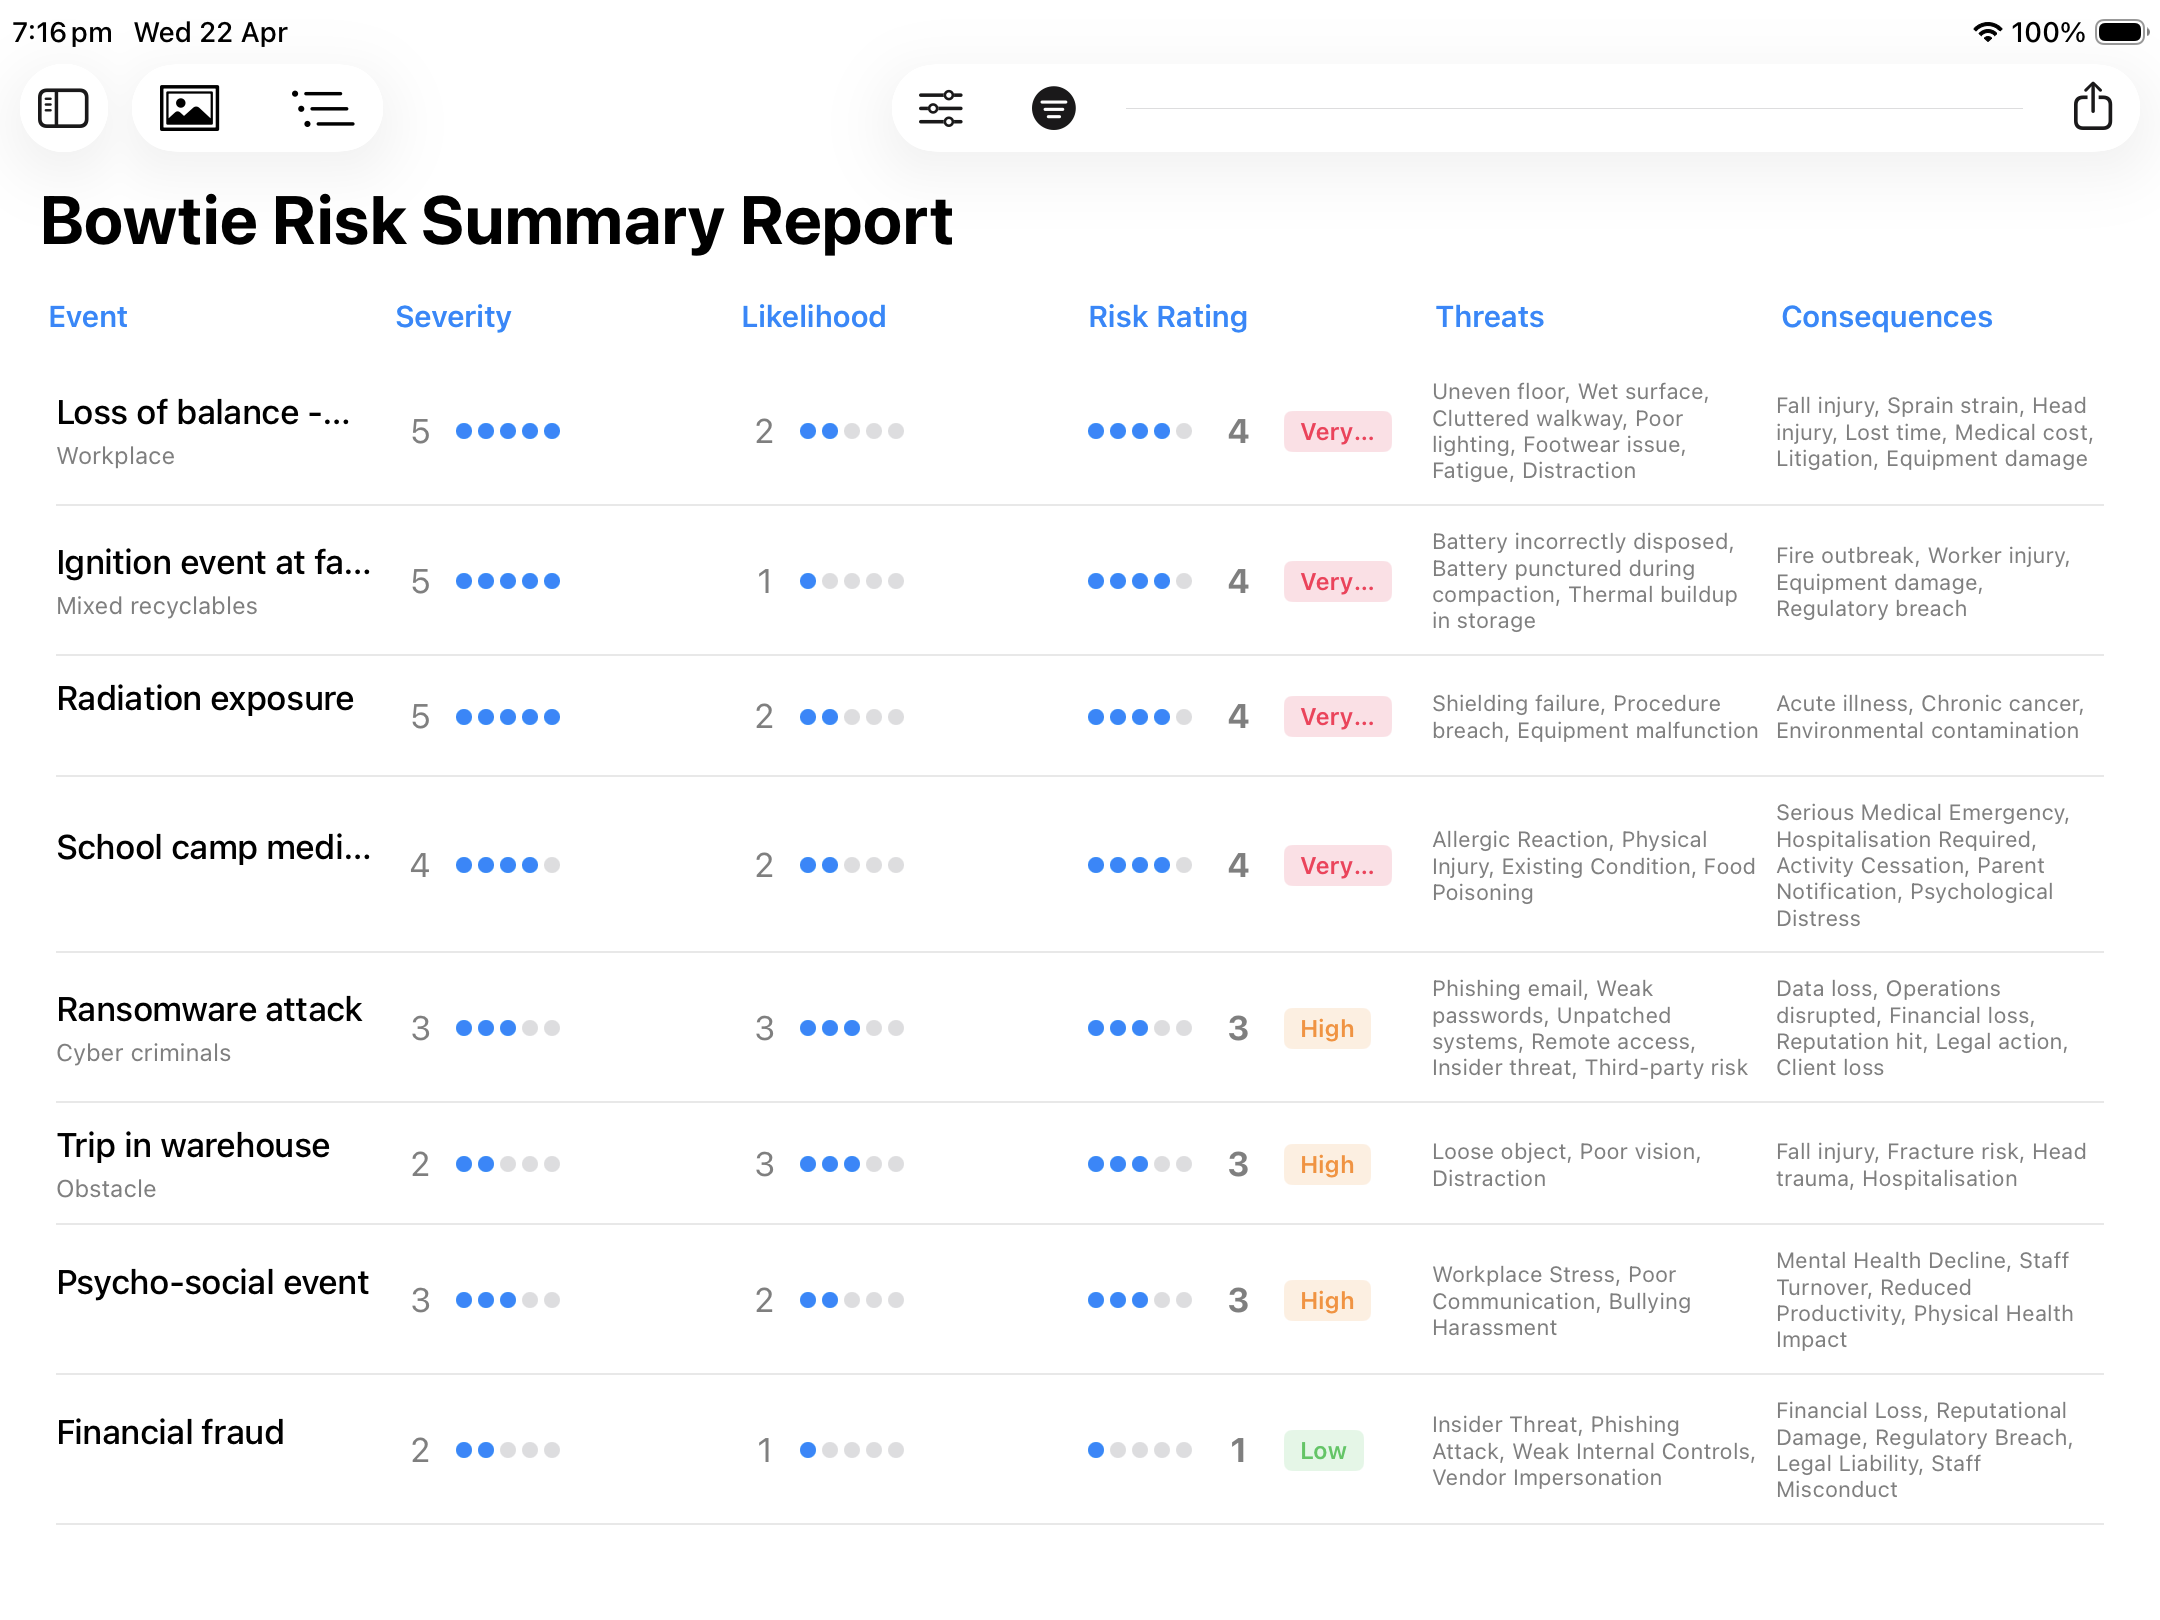
Assessments roll up into a summary register showing each risk event with its inherent and residual rating, causes and consequences.
Use the register to prioritise reviews, brief management or support safety committee meetings. Export diagrams to PDF and JPEG, and assessment data to CSV for reporting, further analysis or your organisation's existing safety system.
Moving from a spreadsheet register? See the Excel risk register alternative.
Review risks before work starts.
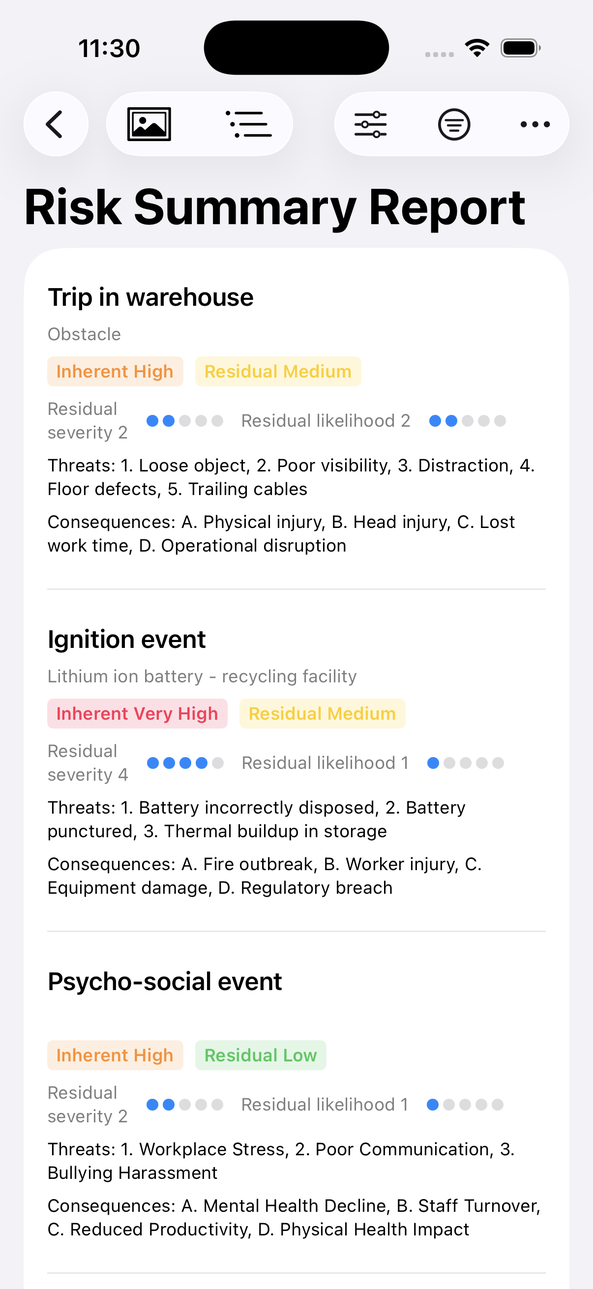
The same assessments open on iPad and iPhone, with or without a connection.
- Pre-start briefings. Workers and contractors can see the risks and controls for a task before they begin.
- Inspections and workshops. Update an assessment on site and pick it up again on the Mac later.
- Works offline. Files are stored on the device or in storage locations your organisation already uses. No cloud account required.
See the whole risk on one page.
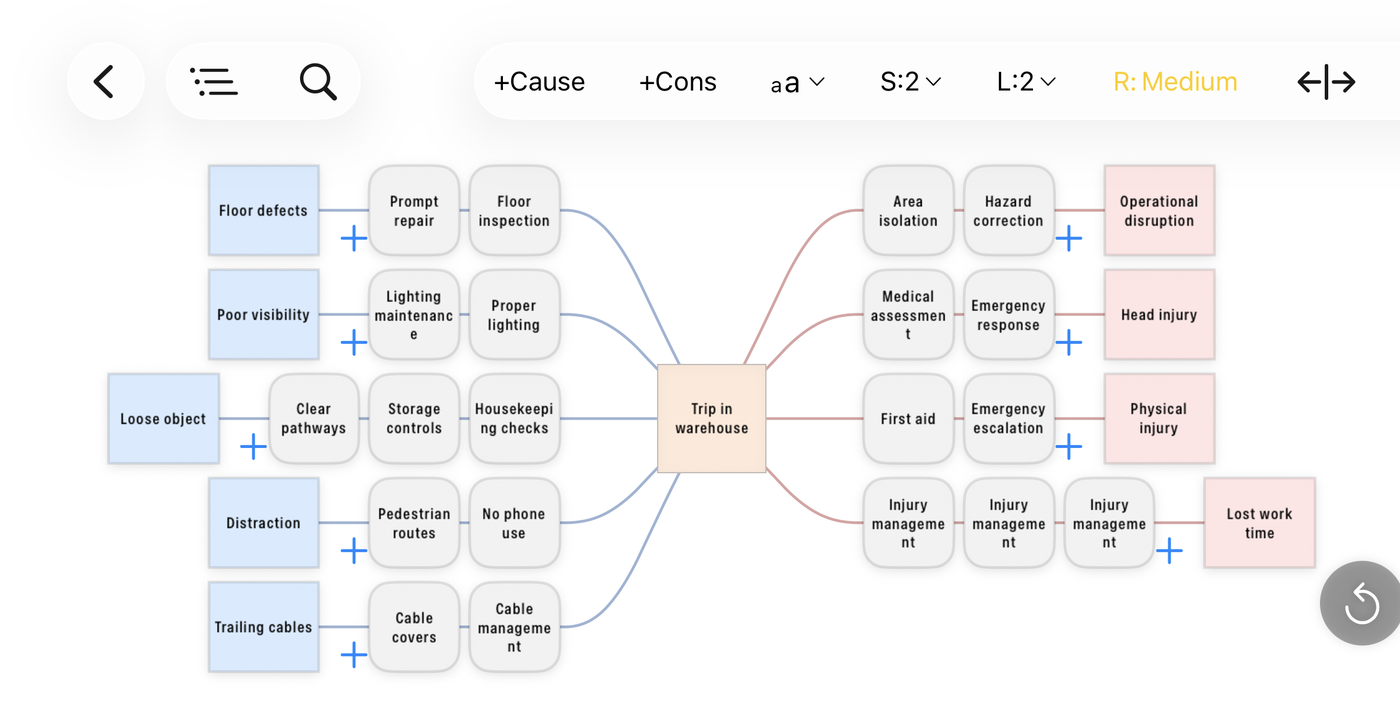
Every assessment can also be viewed as a bowtie diagram, generated from the information you have entered.
Causes are shown on the left, consequences on the right, with the controls that stand between them along each pathway. It's a quick way to walk a team through a risk in a workshop or toolbox talk, and to challenge whether the controls are specific and practical. Learn how a bowtie diagram works →
Psychosocial hazards, assessed like any other risk.
Many regulators now expect employers to manage psychosocial hazards with the same rigour as physical ones.
Workplace stress, poor communication, bullying and harassment can be assessed using the same process: identify the causes, record the preventive controls, set out the consequences for health and the workplace, and show the support and response measures in place. ISO 45003 provides guidance on managing psychosocial risk within an occupational health and safety management system.
Common workplace risk events.
Typical events WHS and HSE teams assess with BowTie Risk.
Slip, Trip or Fall
A person slips or trips on a walkway, floor surface, cable or obstruction.
Fall From Height
A person falls from an elevated work area, ladder, platform or opening.
Plant or Equipment Failure
Plant, machinery or equipment fails during operation and creates a safety event.
Hazardous Substance Exposure
A person is exposed to a chemical, biological or airborne hazardous substance.
Fire or Loss of Containment
Fire, ignition or loss of containment creates the potential for injury, damage or escalation.
Vehicle or Mobile Plant Incident
A vehicle or item of mobile plant strikes a person, object or other vehicle.
Confined Space Incident
A worker is exposed to hazardous conditions while entering or working in a confined space.
Psychosocial Hazard
Workplace stress, poor communication, bullying or harassment affects worker health and wellbeing.
Manual Handling Injury
Lifting, carrying or repetitive tasks lead to a musculoskeletal injury.
Aligned with established risk and safety management standards.
BowTie Risk is built to align with established risk and safety management standards, including ISO 31000, ISO/IEC 31010, ISO 45001 and ISO 45003.
The UK Civil Aviation Authority provides this guidance for use of BowTie diagrams.
Safety risk assessment questions.
Can BowTie Risk be used for WHS and HSE risk assessments?
Yes. BowTie Risk is used to create and edit workplace risk assessments, record hazards, causes, controls and consequences, rate inherent and residual risk, and produce registers and reports. It can be used as part of a documented WHS or HSE risk assessment process.
Can I use my organisation's existing risk matrix and hierarchy of controls?
Yes. The risk matrix can be configured to reflect your organisation's likelihood and consequence scales. Existing controls can be recorded with supporting notes, effectiveness information and escalation detail.
Do I need to know bowtie analysis to use it?
No. Assessments are built from a simple list of the risk event, its causes, its consequences and the controls on each. The bowtie diagram is produced from that information automatically.
Can workers view an assessment on site?
Yes. Assessments and summary reports can be opened on iPad and iPhone, including offline, so a team can review the risks and controls before starting work.
Can safety assessments be exported for review or reporting?
Yes. BowTie Risk can export diagrams to PDF and JPEG and assessment data to CSV for review, reporting and further analysis.
Create a safety risk assessment.
Designed for Mac, iPad and iPhone.