Visualise how risks are managed through barriers. Map threats, preventive barriers, consequences and mitigating barriers in one clear, structured risk assessment.
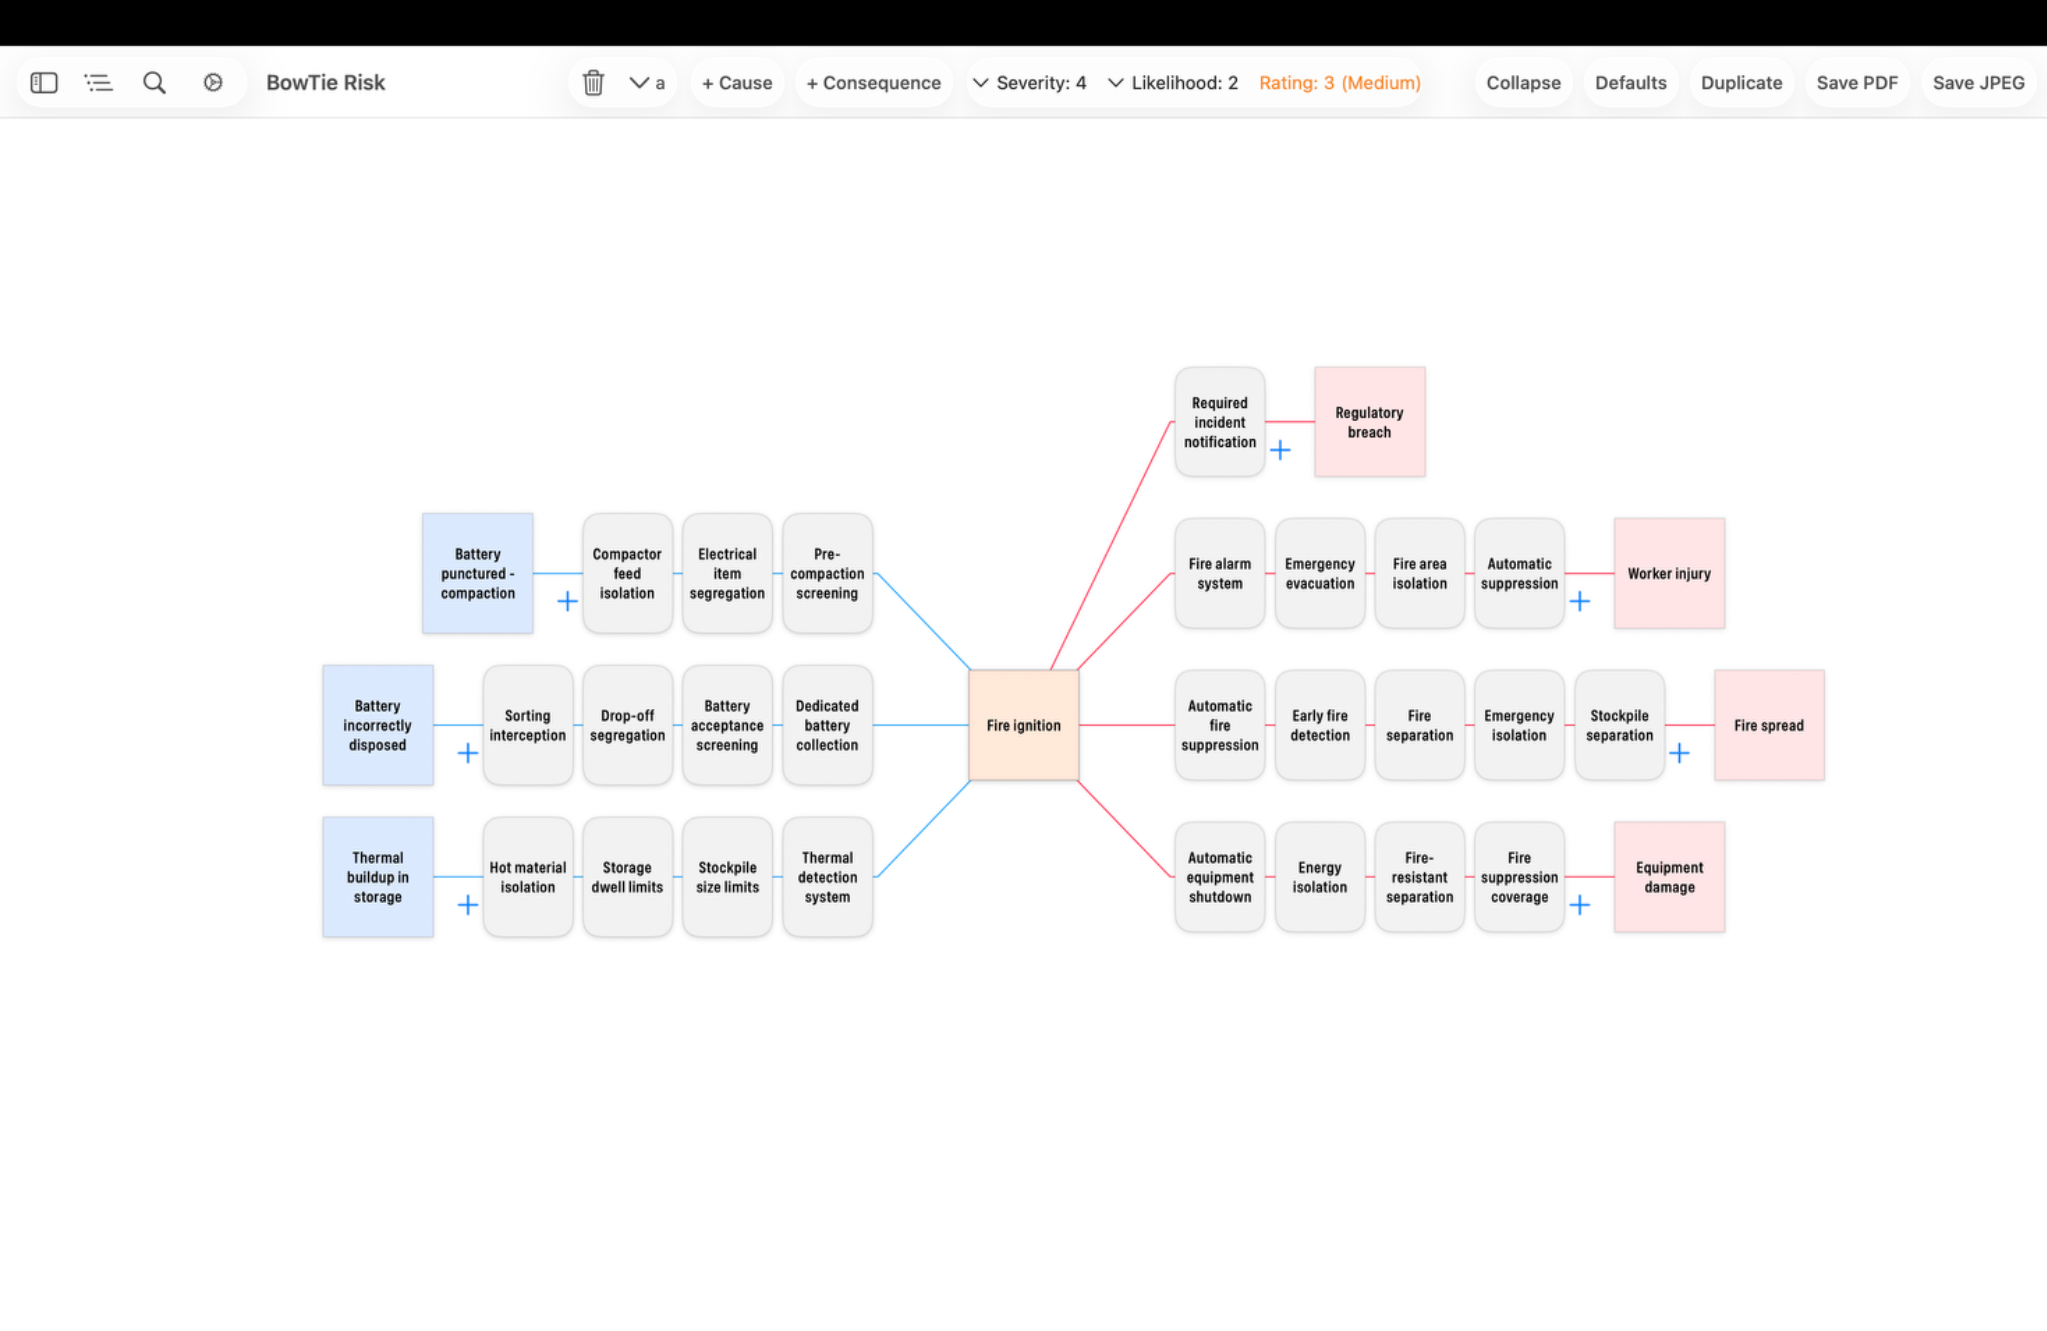
Fire ignition risk showing critical barrier examples alongside simpler barriers.
Bowtie & Barriers
How a bowtie diagram makes barriers visible.
A bowtie diagram shows the pathways from causes to an unwanted event and from that event to its potential consequences — with the barriers that interrupt those pathways clearly positioned between them.
On the left side of the bowtie, preventive barriers sit between each cause and the event and are intended to stop the event from occurring. On the right side, mitigation barriers sit between the event and each consequence and are intended to reduce the likelihood, severity or extent of what follows.
This structure makes it easier to see not simply what can go wrong, but what is relied upon to manage the risk, where barriers may be weak or missing, and which barriers warrant closer attention.
In simple terms: causes → preventive barriers → event → mitigation barriers → consequences. The bowtie turns a risk assessment into a visual map of the barriers protecting each risk pathway.
Barrier Quality
When is a control measure a barrier?
A barrier has a defined function in interrupting a specific risk pathway and should be capable of performing when needed.
A barrier should prevent the risk event or limit a consequence through an identifiable function. A policy, plan or management system may support risk management without itself being the barrier. The barrier is the specific hardware, human action or procedural measure that interrupts the pathway — for example an interlock, physical separation, authorised operator action or emergency shutdown.
Prevention barriers
Sit between a cause and the risk event. Their purpose is to stop the event from occurring. Each cause pathway may require different barriers.
Mitigation barriers
Sit between the event and a consequence. They assume the event has occurred and act to reduce the likelihood or severity of the consequences that follow.
Escalation factors
Conditions that can weaken a barrier, such as fatigue, a bypassed interlock, loss of power, poor maintenance or production pressure. They are not the same as the cause of the event.
Barrier independence
Multiple barriers may not provide genuinely independent layers of protection if they depend on the same sensor, power supply, procedure or person. Visual mapping makes common-mode weakness easier to challenge.
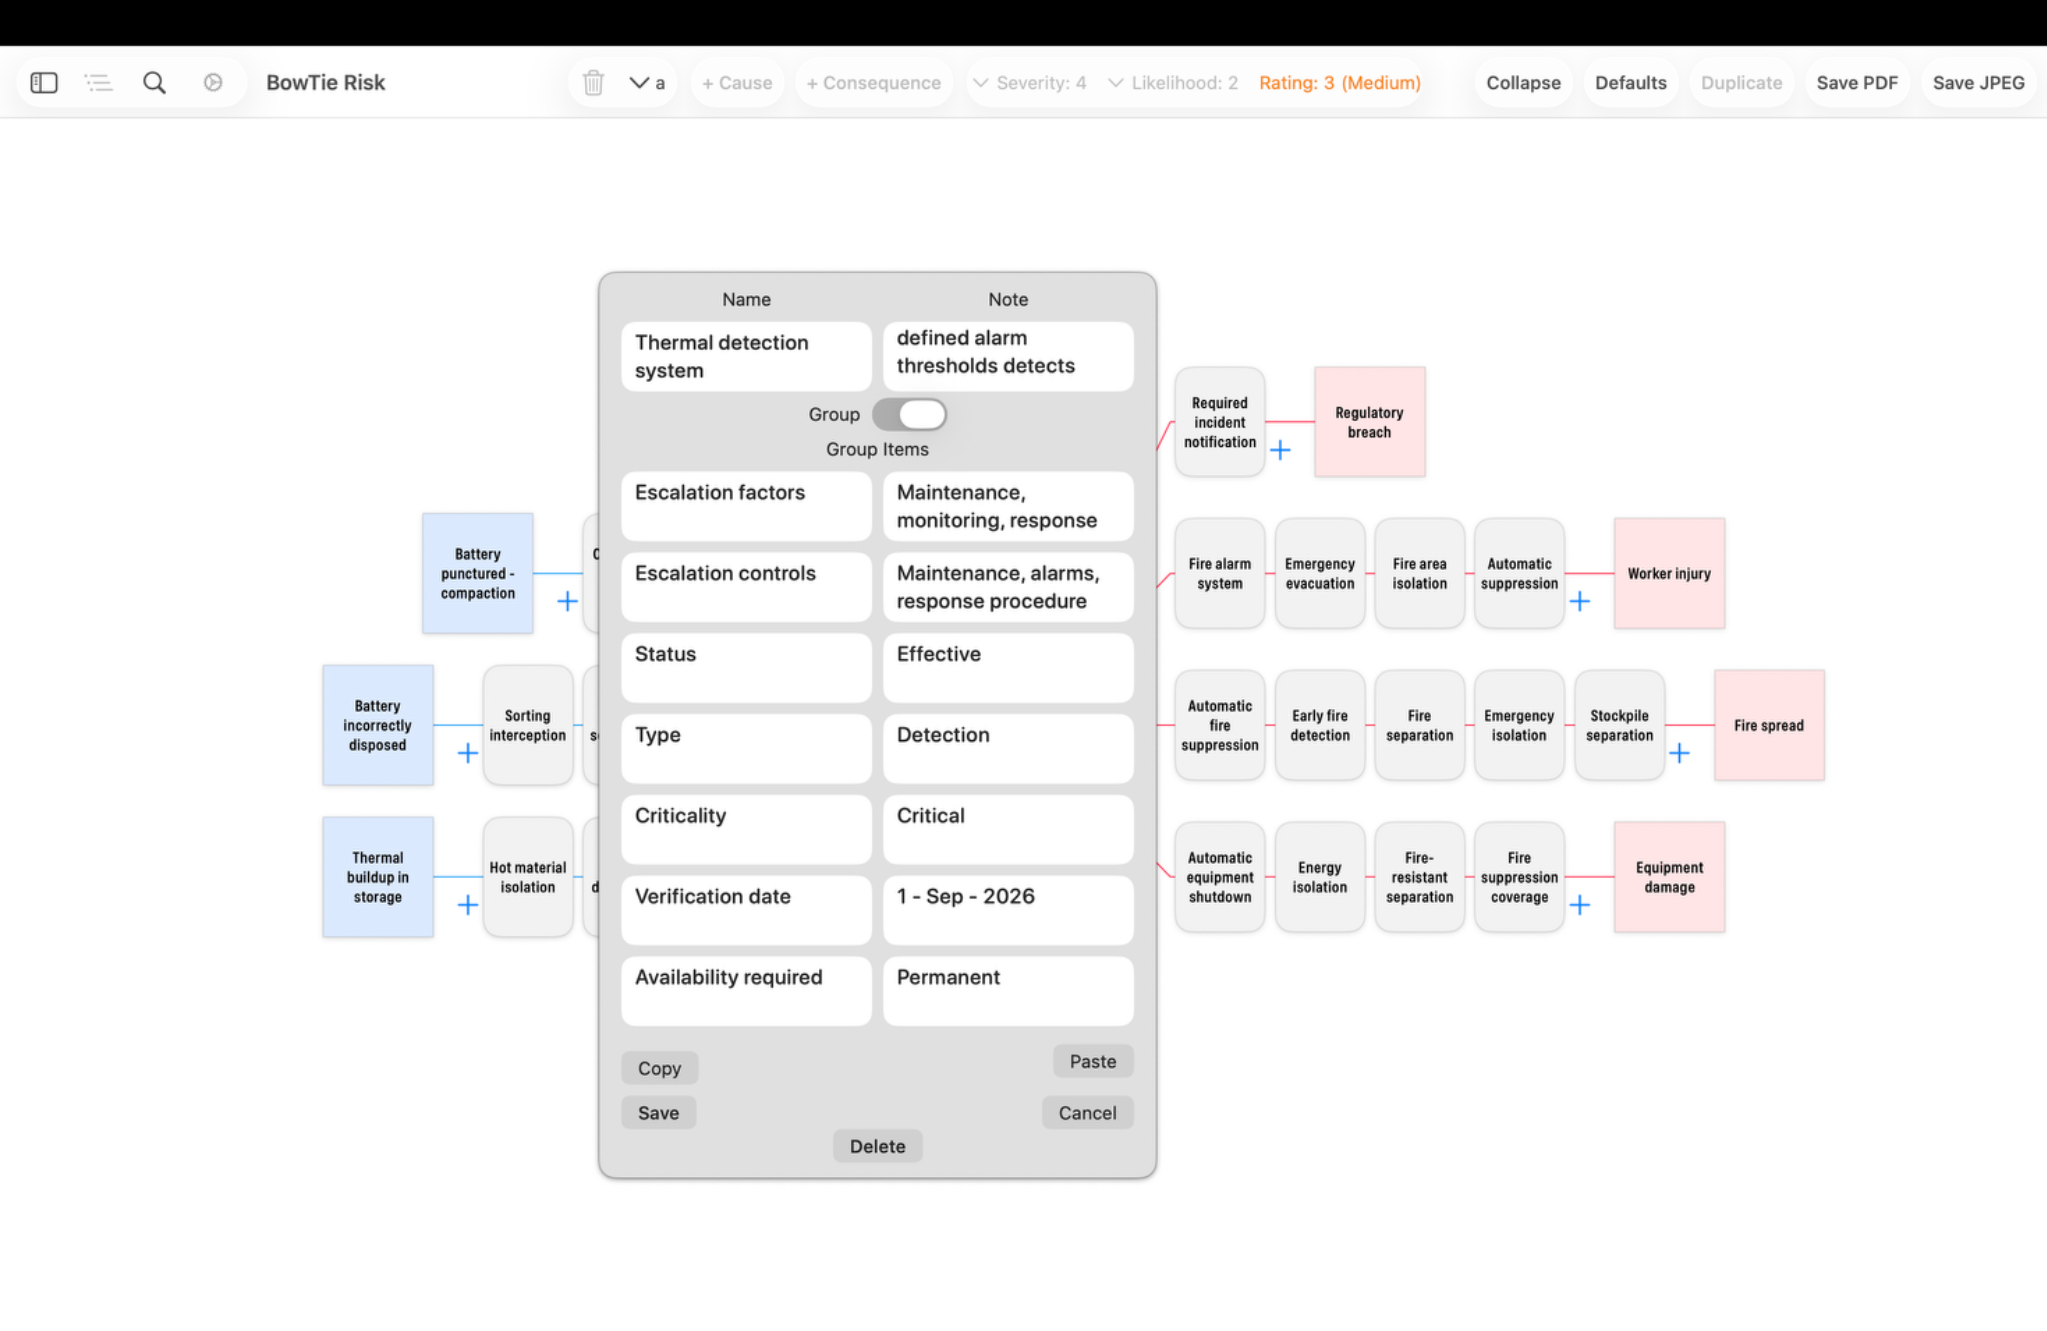
Fire ignition event showing example barrier metadata for the Thermal detection system barrier.
Swiss Cheese Model
Why barriers fail together: the Swiss cheese model.
Psychologist James Reason’s Swiss cheese model of accident causation explains how accidents happen in systems with several layers of protection — and why no single barrier is ever perfect.
In the model, each layer of defence is a slice of Swiss cheese, and every slice has holes: weaknesses that could let a hazard through. Some holes are active failures — errors or violations by people at the front line, with immediate effect. Others are latent conditions — weaknesses created earlier through design, maintenance, staffing, training or management decisions, which can lie dormant for a long time.
The holes aren’t fixed. They open, close and shift as conditions change. An accident happens when holes in several layers line up at the same moment, so a hazard passes through every defence. Most of the time, at least one slice holds.
Swiss cheese model
Holes line up — the hazard passes every layer and causes harmAn intact layer stops the hazard
Each pathway is a trajectory
A path from cause to event to consequence in a bowtie is the line a hazard would follow through the slices.
Each barrier is a slice
The preventive and mitigating barriers along that pathway are its layers of defence.
Escalation factors are holes
Fatigue, a bypassed interlock, deferred maintenance or production pressure are the conditions that open holes in a barrier.
Independence keeps holes apart
Barriers that share a sensor, power supply, procedure or person tend to develop holes together — which is why common-mode dependencies matter.
A model, not a method. The Swiss cheese model explains how layered defences fail, but it doesn’t tell you which barriers you have or where their holes are. A bowtie diagram does that work — mapping each pathway and its barriers so weaknesses can be found and challenged before they line up. The model is also a simplification: real accidents are rarely as linear as a single line through aligned holes, so it’s best used alongside structured analysis rather than instead of it.
Barrier Performance
Good barriers must do more than exist on the diagram.
Barrier management is concerned with whether each barrier can perform its intended function when it is needed.
Effectiveness
Is the barrier capable of interrupting the specific threat pathway or limiting the consequence it is assigned to?
Availability
Is the barrier actually in place and able to act when required, rather than bypassed, unavailable or otherwise out of service?
Reliability
How consistently can the barrier be expected to perform on demand under the conditions in which it operates?
Assurance
What inspection, testing, review, competence check or other evidence supports confidence that the barrier remains effective?
Different barrier types need different assurance. Hardware barriers may depend on inspection and testing; human barriers on competence, workload and information; procedural barriers on currency, usability and compliance. BowTie Risk lets you record supporting information against each barrier using terminology appropriate to your organisation.
Critical Barriers
Focus assurance on what matters most.
Not every barrier warrants the same level of attention. Critical barriers are those whose failure would materially increase exposure to a significant event or consequence.
Identify critical barriers
Use the risk pathways to identify the barriers most important to preventing the event or limiting serious consequences. These may also be described as critical controls in some organisational frameworks.
Prioritise assurance
Give greater assurance attention to barriers that protect the most significant pathways, particularly where there are few alternatives or important dependencies.
Your classification scheme, not ours. Organisations describe barrier condition differently — effective/degraded/failed, criticality classes, safety-critical element flags or internal performance scores. BowTie Risk provides metadata fields for each barrier, allowing you to record effectiveness, criticality, escalation factors, ownership and other supporting information using the terminology and framework that suits your organisation. Custom versions can incorporate your organisation’s classification scheme and requirements — see Pricing.
Barrier Information & Export
Keep the information behind each barrier.
A bowtie shows the barriers visually, while BowTie Risk lets you retain supporting metadata for each barrier and export the underlying information for further analysis, review and reporting.
Barrier metadata
Record supporting information against individual barriers, including notes and organisation-specific information such as effectiveness, criticality, escalation factors, ownership or other classifications relevant to your barrier-management framework.
Export your barrier data
Export the assessment data, including barrier information and supporting metadata, so it can be reviewed, analysed or incorporated into your organisation’s wider risk-management and reporting processes.
Beyond Safety
Barrier management applies across risk domains.
Barrier management applies wherever barriers act to prevent an event or limit its consequences.
Safety & Process Risk
Barriers can prevent loss of control or limit the consequences when it occurs.
Cybersecurity
Barriers can prevent a cyber event, limit its spread and support recovery.
Operational Risk
Barriers can reduce the likelihood of operational failure or limit its consequences.
Environmental Risk
Barriers can prevent environmental events or limit their impact and support recovery.
Frequently Asked Questions
Barrier management questions.
What is barrier risk management?
It is a barrier-focused way of analysing and managing risk pathways. Preventive barriers act before the event, mitigating barriers act after it, and their effectiveness, availability, reliability and degradation can be considered alongside the causes and consequences they protect.
What is the difference between a preventive barrier and a mitigation barrier?
A preventive barrier aims to stop the event from occurring. A mitigation barrier assumes the event has occurred and aims to reduce the resulting consequence.
What makes a barrier critical?
Criticality depends on the risk and the organisation's criteria. In general, a barrier is more likely to be treated as critical where its failure would materially increase exposure to a serious event or consequence.
Is barrier management the same as bowtie analysis?
No. Barrier management is broader. Bowtie analysis is a particularly useful visual technique for showing causes, preventive barriers, the event, consequences and mitigating barriers on one page.
How does the Swiss cheese model relate to bowtie diagrams?
The Swiss cheese model explains why layered defences fail: each barrier has weaknesses, and harm occurs when weaknesses in several barriers line up. A bowtie diagram puts that idea into practice by mapping each risk pathway and the barriers along it, so you can see where barriers are weak, missing or dependent on each other.
Can BowTie Risk use our own barrier-effectiveness scheme?
Yes. Supporting data can be recorded against barriers so you can retain your own effectiveness, degradation, criticality or performance terminology.
Make your barriers visible.
Build clear barrier-based risk assessments on Mac, iPad and iPhone.